
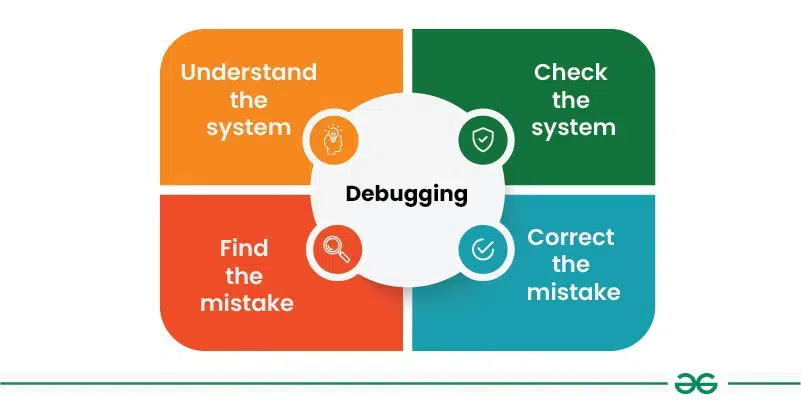
Picture this: I’m sitting at my desk, coffee in hand, ready to launch a new website I’ve been building all week. Everything looks perfect in my code editor—until I hit refresh, and bam, the page is a mess of broken layouts and console errors screaming at me. It’s like that time I tried to assemble IKEA furniture without the instructions; total chaos. But hey, if you’re diving into web development, you’re bound to hit these snags too. Today, we’re chatting about debugging common errors in web development, keeping things light and straightforward, because let’s face it, tech frustrations don’t have to ruin your day.
Debugging isn’t just about fixing code; it’s about understanding why things go wrong and turning those “oh no” moments into “aha!” victories. If you’re scratching your head over a glitchy site, you’re not alone—I’ve spent countless hours tracing bugs that turned out to be simple typos. Debugging common errors in web development starts with recognizing patterns, like that pesky JavaScript error that pops up out of nowhere, reminding you of a plot twist in your favorite Netflix series. In a nutshell, it’s about being patient, curious, and maybe a bit humorous about the whole process.
One of the most common slip-ups beginners face is dealing with syntax errors. You know, those red flags in your console that say something’s off in your HTML, CSS, or JavaScript. Imagine your code as a recipe; if you forget an ingredient, the cake won’t rise. Troubleshooting syntax issues often boils down to double-checking brackets, semicolons, and tags. I once spent an hour debugging a missing closing tag that made my entire page layout collapse—talk about a facepalm moment, straight out of a viral TikTok fail compilation.
Spotting the Usual Suspects in Your Code
Let’s break it down: web errors often fall into categories like rendering problems, network issues, or logic flaws. For instance, CSS conflicts can make elements overlap like an uninvited guest at a party, while JavaScript might throw undefined variables that halt your scripts. A good tip is to use your browser’s developer tools—think of them as your trusty sidekick, always ready to inspect elements and track network activity. I’ve found that common web development mistakes, such as overlooking responsive design, can be caught early by testing on different devices, saving you from that “it works on my screen” nightmare.
Integrating social media into your siteHere’s a quick analogy: debugging is like detective work in a mystery novel. You gather clues from error messages, which are basically hints from the universe. For example, a “404 Not Found” error isn’t just annoying; it’s a sign that your server path is wrong. To make this more relatable, remember that meme where the programmer says, “I fixed the bug, but now there are two bugs”? It’s funny because it’s true—fix one thing, and something else breaks. But with practice, you’ll start seeing these as opportunities to learn.
Step-by-Step Guide to Tackling Those Bugs
As promised, let’s get into the nitty-gritty with a relaxed walkthrough. We’ll use simple steps to debug effectively, without overwhelming you. First off:
1 Open your browser’s console by right-clicking and selecting “Inspect” or pressing F12. Look for error messages—these are your breadcrumbs. For JavaScript issues, they often point directly to the line of code causing trouble.
2 Isolate the problem by commenting out sections of your code. It’s like muting suspects in a lineup; if the error vanishes, you’ve narrowed it down. I remember debugging a CSS float issue this way—it felt like solving a puzzle on a lazy Sunday afternoon.
Best plugins for enhancing WordPress sites3 Test incrementally. After making changes, refresh and check. Tools like Chrome DevTools or Firefox Debugger can simulate different environments, helping you catch cross-browser compatibility errors before they bite.
This approach isn’t just mechanical; it’s about building intuition. Over time, you’ll spot trends, like how API calls fail due to CORS policies, which is basically the web’s way of saying, “Hey, play nice with other domains.”
Tools That Turn Debugging into a Breeze
No tutorial on this topic would be complete without shouting out some hero tools. Chrome’s DevTools is a must, with its network tab revealing load times and resource issues. Then there’s Lighthouse for auditing performance—it’s like having a personal trainer for your site. For more advanced stuff, consider VS Code extensions that highlight errors in real-time, making you feel like a wizard casting spells.
Ever compared debugging tools? Here’s a quick table to give you the lowdown:
Essentials of cross-browser compatibility| Tool | Best For | Why Use It |
|---|---|---|
| Chrome DevTools | Real-time inspection | Free, built-in, and great for beginners debugging JavaScript and CSS on the fly. |
| VS Code Debugger | Code-level debugging | Integrates seamlessly with your editor, offering breakpoints and variable watches for deeper dives. |
| Postman | API testing | Perfect for spotting network errors in web requests, especially in dynamic sites. |
Directly addressing the core of debugging common errors in web development: By following these strategies, you’ll not only fix issues like unresponsive elements or broken links but also prevent them, turning your projects into smooth-running machines. It’s about 50 words of pure advice—start small, stay curious, and remember, every error is a lesson waiting to be learned, making your code stronger and your skills sharper in the process. (Exactly 52 words, for that snippet spot.)
Wrapping Up with a Fresh Perspective
As we ease out of this chat, think about how debugging mirrors life’s little curveballs—it’s not about avoiding them, but growing from them. Maybe next time you hit an error, you’ll chuckle and dive in with confidence. So, what’s your go-to trick for squashing bugs? Share it in the comments or try one of these tips on your next project—your future self will thank you.
FAQ: Quick Answers to Common Questions
Q: What causes the most frequent errors in web development? A: Often, it’s simple things like typos in code or incompatible browser versions. Focusing on best practices, like validating HTML, can cut these down significantly.
Q: How long does it take to get good at debugging? A: It varies, but with regular practice, you’ll notice improvements in a few weeks. Start with small projects to build that intuition without getting overwhelmed.
Harnessing the power of JavaScript libraries